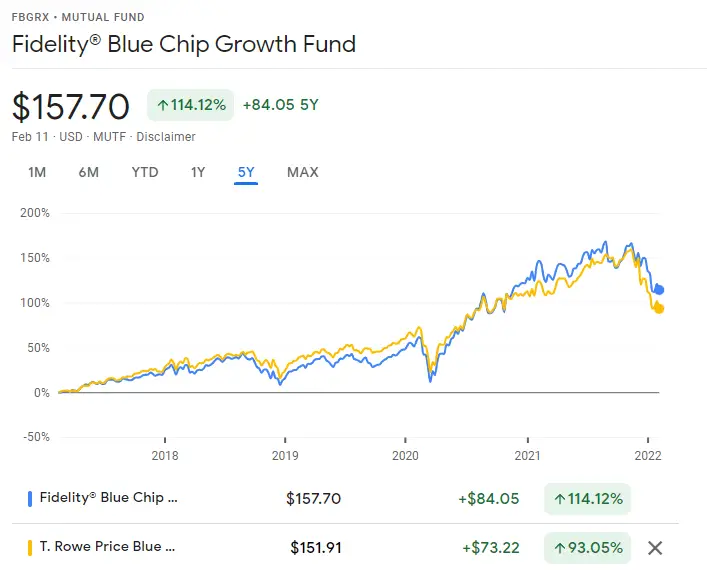
In this post, we will be comparing FBGRX and TRBCX. They are both growth funds, but there are some key differences that investors should know about before choosing one.
FBGRX vs TRBCX: What Are the Differences?
- FBGRX is managed by Fidelity Investments, while TRBCX is managed by T. Rowe Price.
- The Fidelity Growth Fund has an expense ratio of 0.79% per year, whereas the T. Rowe Price Blue Chip Growth Fund charges 0.68% per year. If you had 10,000 invested in FBGRX and its expense ratio is 0.79%, that comes out to $79 in fees paid to the fund manager.
- TRBCX’s portfolio is very concentrated, with the fund only holding a total of 91 stocks. FBGRX, on the other hand, is more diversified. Its entire portfolio consists of more than 400 stocks.
- FBGRX pays dividends to shareholders every September and December, while TRBCX does it once a year in December.
FBGRX vs TRBCX: How Are They Similar?
- FBGRX and TRBCX are both growth mutual funds. They invest in medium and large-cap blue chip companies with “above-average growth potential.”
FBGRX vs TRBCX: Portfolio Composition
FBGRX Top 10 Holdings
| COMPANY | SYMBOL | TOTAL NET ASSETS |
|---|---|---|
| Apple Inc. | AAPL | 9.87% |
| Microsoft Corp. | MSFT | 6.91% |
| Amazon Inc. | AMZN | 6.46% |
| Alphabet Inc. Cl A | GOOGL | 6.36% |
| NVIDIA Corp. | NVDA | 5.90% |
| Meta Platforms Inc. | FB | 4.08% |
| Tesla Inc. | TSLA | 3.59% |
| Marvell Technology Inc. | MRVL | 3.43% |
| Lowe’s Cos. | LOW | 1.61% |
| Salesforce Inc. | CRM | 1.61% |
TRBCX Top 10 Holdings
| COMPANY | SYMBOL | TOTAL NET ASSETS |
|---|---|---|
| Microsoft Corp. | MSFT | 11.10% |
| Amazon Inc. | AMZN | 9.79% |
| Alphabet Inc. Cl C | GOOG | 8.97% |
| Apple Inc. | AAPL | 7.76% |
| Meta Platforms Inc. | FB | 6.64% |
| NVIDIA Corp. | NVDA | 3.25% |
| Visa Inc. Cl A | V | 2.31% |
| ServiceNow Inc. | NOW | 2.29% |
| Tesla Inc. | TSLA | 2.09% |
| Intuit Inc. | INTU | 2.02% |
FBGRX vs TRBCX: Performance and Returns
| Funds | Fidelity® Blue Chip Growth Fund | T. Rowe Price Blue Chip Growth Fund |
|---|---|---|
| 1 month | -11.40% | -10.76% |
| 3 months | -12.02% | -12.18% |
| 6 months | -5.59% | -9.01% |
| 1 year | +7.40% | +6.46% |
| 3 years | +28.97% | +18.29% |
| 5 years | +25.29% | +19.56% |

Which is Better, FBGRX or TRBCX?
Overall, TRBCX and FBGRX are fairly similar, and they are ideal at providing access to some of the largest companies in the U.S with the prospect of offering better returns than value funds.
TRBCX may be a better option for those who want to pay fewer expenses, therefore, saving them more money in the long run. However, FBGRX prioritizes diversification, which can help balance out the risks associated with investing in growth stocks.
Another important factor to consider is what other investors are saying about each fund. The Fidelity Blue Chip Growth Fund currently has a 5-star rating on Morningstar. The T. Rowe Price Blue Chip Growth Fund currently has an overall rating of 3 stars.
Similar Comparisons
1 post – 1 participant
