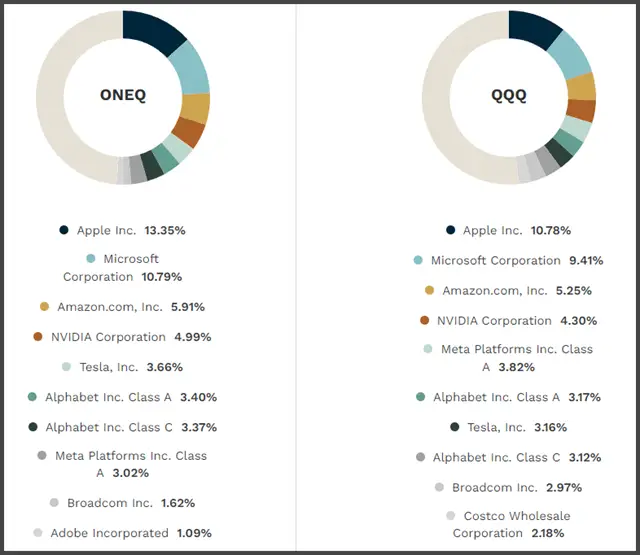
As a Fidelity investor, are you curious about the mutual fund equivalent of Invesco’s popular QQQ ETF, a mirror of the NASDAQ 100 index. that primarily features heavyweight tech giants like Apple, Microsoft, Facebook, and Alphabet.
Discover Fidelity’s top mutual funds and ETF alternatives that mirror the Invesco QQQ ETF growth-oriented strategy that feature low fees and similar NASDAQ-100 exposure. This article compares their performance and fees, and provides actionable insights for portfolio allocation.
What is the Invesco QQQ ETF (Nasdaq 100)?
Thanks to the booming technology sector and the substantial market caps of tech companies, QQQ has been a highly successful ETF.
- What type of fund is QQQ? QQQ is a growth index exchange-traded fund that tracks the top 100 listed companies of the 3,000 Nasdaq-listed stocks
- essentially follows the Nasdaq 100 index. It’s a “set-it-and-forget-it” type of fund designed to follow the market rather than attempt to outperform it
- Holdings: QQQ’s portfolio is predominantly comprised of large-cap technology stocks, including: Apple, Microsoft, Amazon and Alphabet (parent company of Google)
- Performance: 10-year average return of 14.3%
- Expense Ratio: 0.29%
What are QQQ’s Top 10 Holdings?
| COMPANY | SYMBOL | TOTAL NET ASSETS |
|---|---|---|
| Apple Inc. | AAPL | 11.69% |
| Microsoft Corp. | MSFT | 10.13% |
| Amazon Inc. | AMZN | 6.78% |
| Meta Platforms Inc. | FB | 4.78% |
| Tesla Inc. | TSLA | 4.26% |
| NVIDIA Corp. | NVDA | 4.15% |
| Alphabet Inc. Cl C | GOOG | 3.69% |
| Alphabet Inc. Cl A | GOOGL | 3.50% |
| Broadcom Inc. | AVGO | 1.82% |
| Adobe Inc. | ADBE | 1.80% |
Disclaimer: There’s No Exact QQQ Mutual Fund Equivalent
While there isn’t a “QQQ” mutual fund in the traditional sense, Invesco does offer a mutual fund called the “Invesco Nasdaq 100 Index Fund” (ticker: IVNQX) which essentially tracks the same Nasdaq-100 index as the QQQ ETF.
However, access to IVNQX is often restricted to institutional investors (or large investment amounts) to access a similar portfolio structure through a mutual fund structure, primarily aimed at retirement accounts where ETFs might not be available.
Fortunately, many self-directed retirement accounts now allow investors to purchase ETFs directly from their Roth IRA or 401k retirement accounts.
QQQ Mutual Fund Equivalent for Fidelity Investors
For investors seeking exposure to the tech-heavy NASDAQ-100 index through mutual funds, Fidelity offers several compelling alternatives to the Invesco QQQ ETF (QQQ).
- Fidelity NASDAQ Composite Index Fund (FNCMX): Tracks the NASDAQ Composite Index, which includes over 3,000 NASDAQ-listed stocks, providing broader exposure than the NASDAQ-100.
- Top Holdings: Apple (8.2%), Microsoft (6.7%), Amazon (4.1%)
- Performance: 10-year average return of 14.3%
- Expense Ratio: 0.29%
- Fidelity Growth Company Fund (FDGRX): Actively managed with a focus on large-cap growth stocks, overlapping significantly with QQQ’s holdings.
- Top Holdings: Meta Platforms, NVIDIA, Tesla.
- Differentiator: Higher exposure to mid-cap growth stocks.
- Expense Ratio: 0.69%
- Fidelity Mega Cap Stock Fund (FGRTX): Invests in companies with market caps over $20 billion, mirroring QQQ’s mega-cap tilt.
- Performance: 5-year annualized return of 12.8%.
- Expense Ratio: 0.56%
Fidelity’s QQQ Exchange-Traded Fund Alternative
Next, we’ll introduce you to Fidelity’s ETF alternative to QQQ, the Fidelity Nasdaq Composite Index ETF ($ONEQ).
Unlike QQQ, which focuses on the top 100 non-financial companies, ONEQ is market-cap-weighted composite index that tracks 833+ companies listed on the Nasdaq exchange. This makes ONEQ more diversified and provides broader exposure than QQQ’s NASDAQ-100.
- Fidelity Nasdaq Composite Index ETF (ONEQ): Invests in companies with market caps over $20 billion, mirroring QQQ’s mega-cap tilt.
- Top Holdings: Meta Platforms, NVIDIA, Tesla
- Performance: 5-year annualized return of 12.8%.
- Expense Ratio: 0.21%. Its low turnover rate of 11% indicates stability in its holdings.
.
Launched in 2003, ONEQ boasts a reasonable expense ratio of
QQQ edges slightly ahead in terms of expense ratio, sitting at 0.20%, compared to ONEQ’s 0.21%. The difference here is unnoticeable.
Portfolio Composition
In contrast, ONEQ’s portfolio has over 1,000 different stocks on the Nasdaq exchange (including those in the QQQ).

Comparing Performance
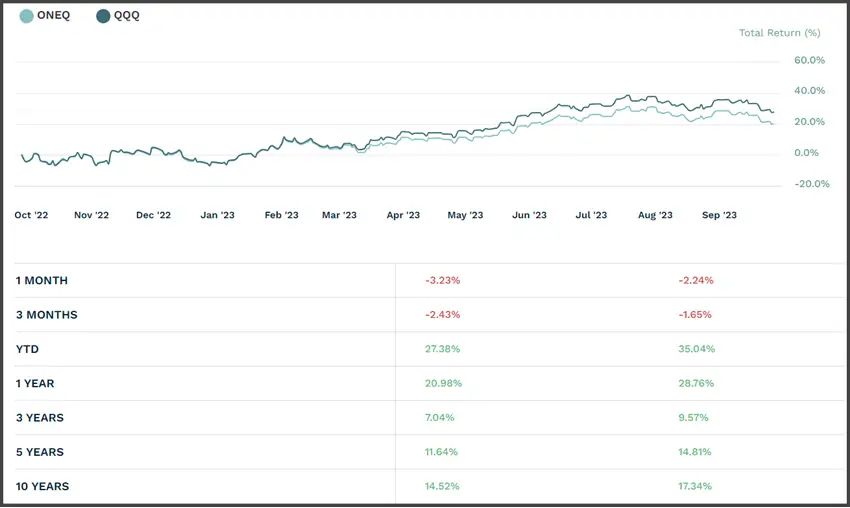
Let’s explore the similarities and differences between the two funds:
In the last 5 years, QQQ has demonstrated average annual returns of +14.82%, while ONEQ has shown +11.64%.
Both funds have received a top-notch Morningstar rating of 5/5 and fall under the “Large Growth” category.

Choosing Between QQQ vs. ONEQ
For those placing a premium on diversification, ONEQ may be the preferred choice. It contains a larger basket of stocks, though this could come at a slight sacrifice in growth potential.
If you’re comfortable with some risk and volatility, QQQ may offer higher returns.
Reader Insights
Our readers have shared additional nuggets of wisdom. Some recommend considering alternative ETFs like QQQM for a lower expense ratio and better performance in the long run.
In conclusion, when seeking the Fidelity equivalent of QQQ, look no further than ONEQ.
By aligning your investment strategy with Fidelity’s low-cost, diversified options, you can replicate QQQ’s tech-driven returns while leveraging mutual fund advantages like automated contributions and fractional shares.
